OEE & Machine Utilization: Resource Hub for Job Shops
OEE is the most powerful machine metric in manufacturing — and the most misunderstood. This hub organizes every article we've published on OEE, utilization, and downtime.
Why OEE is the metric most job shops measure last
"The machine ran all day" and "the machine made good parts at rate all day" are two completely different statements. Overall Equipment Effectiveness (OEE) is the metric that tells you the difference — and it's the one most shops get to last, after they've already spent years optimizing everything around it.
There's a structural reason it matters. A two-shift, Monday-to-Friday operation runs 80 of the 168 hours in a week. Before a single machine breaks down, before one setup runs long, calendar utilization is already capped below 50%. Everything OEE measures happens inside that window. Lose track of it and you're guessing at the one number that decides whether you can take the next job without buying another machine.
We've published a lot on OEE, utilization, downtime, and the KPIs that connect them. This OEE resource hub pulls all of it into one place, organized so a production manager can start wherever the current fire is.
Start here: what OEE actually measures
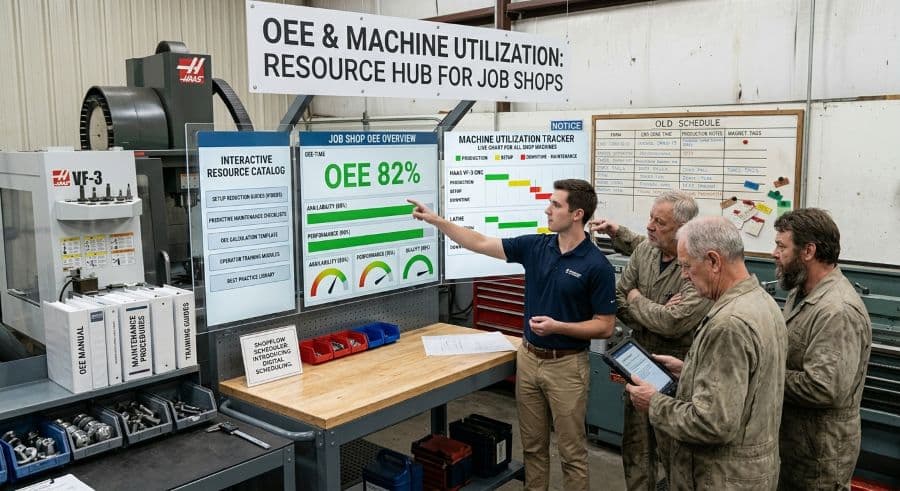
OEE is one formula: Availability × Performance × Quality. Three numbers, multiplied, that each quietly take a cut out of a machine's theoretical output. A machine that's available 90% of the time, running at 90% of rate, and producing 95% good parts isn't at 90% — it's at 77%. The multiplication is what surprises people.
If you've never run the math for your shop, start with the full OEE calculation guide for manufacturers, which works through each factor with real numbers.
World-class OEE sits at 85% (Nakajima/TPM literature). Most shops that calculate it honestly for the first time land well below that — not because the equipment is bad, but because availability, performance, and quality each take a bite no one was tracking.
Measure your machines honestly
OEE is the headline metric, but it sits on top of simpler ones you should be tracking first. Machine utilization rate is the most basic: what share of available time a machine is actually cutting. Our machine utilization rate calculator and guide gives you the formula and a clean way to baseline every machine on the floor.
Utilization and OEE don't live alone. They belong in a short list of numbers that actually predict whether you'll hit due dates. The production scheduling metrics and KPIs guide sorts the ones worth tracking for a job shop from the vanity numbers that look good in a meeting and tell you nothing.
What poor utilization actually costs
Low utilization isn't an abstract efficiency problem — it carries a dollar figure. Manual scheduling alone quietly bleeds 5–10% of revenue in a typical job shop (Qlector 2025); we break down where that money goes in the real cost of manual production scheduling.
Downtime is the other half of the bill. Unplanned downtime runs about 35% more expensive than planned downtime (Arda Cards 2026), and most shops never put a number on it at all. The cost of unplanned downtime for a job shop shows how to size it. When you want the total impact for your own shop rather than a benchmark, the ROI calculator does the arithmetic from a few inputs.
Plan capacity, don't just measure it
Measurement tells you where you are. Capacity planning tells you whether you can say yes to the next job without breaking a promise you already made. The machine capacity planning guide connects utilization data to actual scheduling decisions — how much real capacity you have once setups, maintenance windows, and the calendar are subtracted from the theoretical total.
For the wider picture — how utilization, capacity, and metrics fit into running the whole schedule day to day — the complete guide to production scheduling for job shops is the pillar that ties this cluster together.
How to use this OEE resource hub
If the metric is new to you, read the calculation guide first, then baseline one machine with the utilization calculator before you try to fix anything. If you already track OEE and want to act on it, jump to capacity planning and the cost articles. Whether you're tracking this in a spreadsheet, an ERP module, or nothing at all today, the order that works is the same: measure honestly, price the gap, then plan around it.
Put the numbers to work
You can run all of this in a spreadsheet, and plenty of shops do. Our Machine Utilization & OEE Tracker is a $25 spreadsheet with the formulas, the dashboards, and the per-machine baselines already built, so you're not assembling them from a blank sheet.
If you'd rather stop maintaining a tracker entirely and watch utilization update as you schedule, that's what Visual Machine Scheduler does — see how the scheduling and reporting works, or start a free trial (no credit card, 14 days). Bookmark this OEE resource hub; we add to it as we publish.
Ready to go beyond the guide?
Most shops are on a live Gantt board within 60 minutes of sign-up, with their existing job list imported from Excel.
Get shop floor scheduling guides in your inbox
Practical articles for production managers — no spam, unsubscribe anytime.
Related articles
The True Cost of Unplanned Machine Downtime in a Job Shop (It's 35% More Than You Think)
Unplanned downtime doesn't just cost the hours the machine is stopped — it costs the resequencing labor, the emergency o…
OEE Calculation for Manufacturers: A Plain-English Guide with Examples
OEE is the most important machine metric most job shops never track. Availability × Performance × Quality = your real ma…
How to Calculate Machine Utilization Rate (With Free OEE Template)
Machine utilization rate is one of the most important metrics in a job shop, but most production managers have no reliab…